Program newsHyatt World of Hyatt: policy change, announced Oct 15. Read more
Loyalty Program Devaluation Index
Latest prices: October 2026Checked Oct 16 – Oct 21, 2026Site updated Oct 21, 2026Next update: November 2026

Are airline and hotel points losing value? I built an index to measure it.

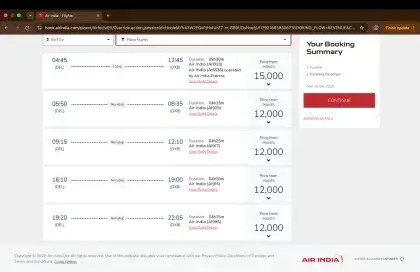
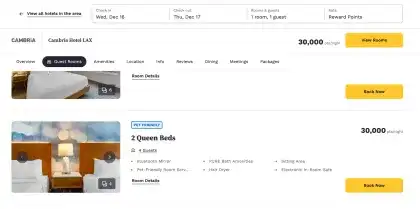
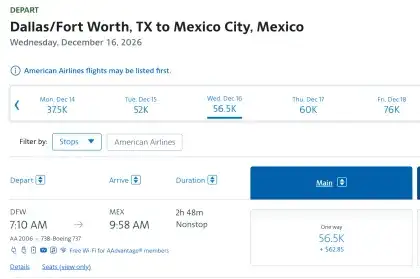
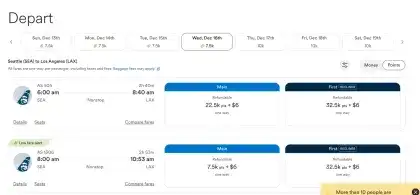
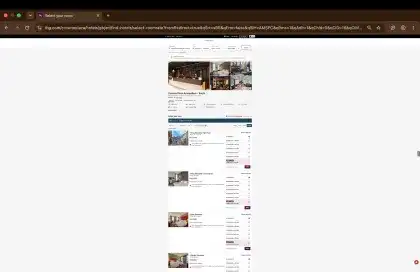
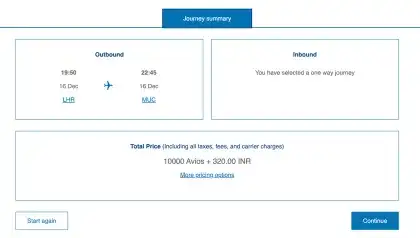
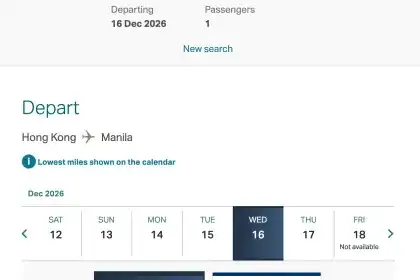
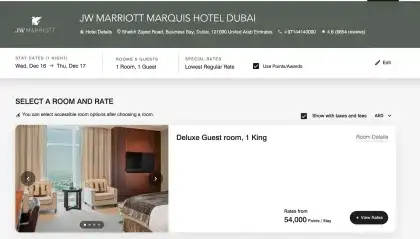
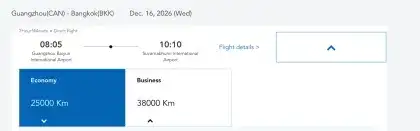
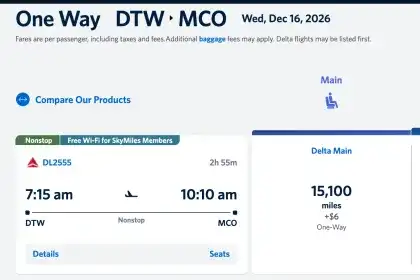
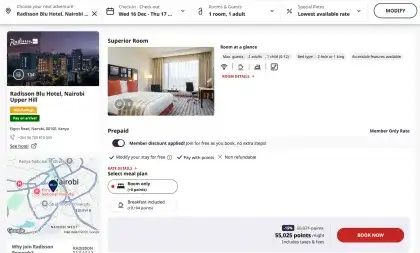
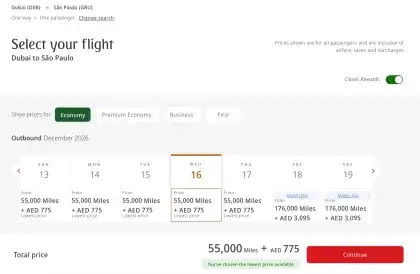
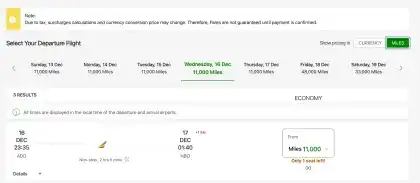
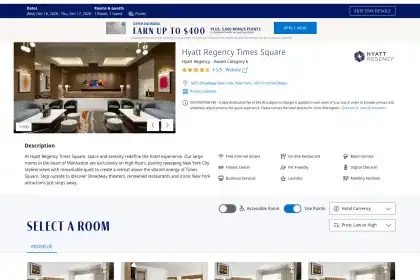
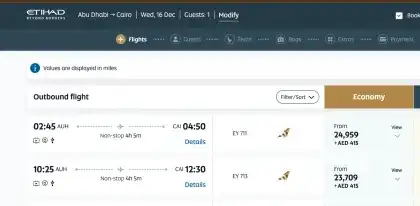
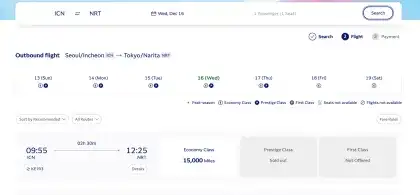
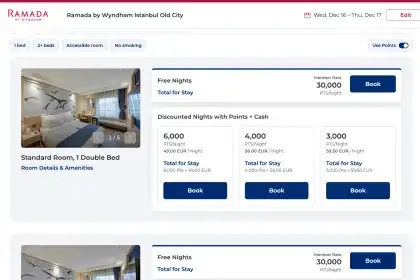
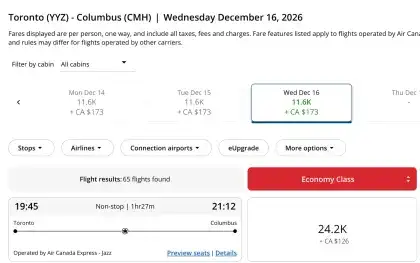
Points are a currency that airlines and hotels issue themselves, and they can change what it buys at any time, usually without telling anyone. Travel sites publish one value per program each month, but not the data behind it or how it changes over time. So every month I search the same 88 flights and hotel nights across 27 programs, in points and in cash, and screenshot every result. So far that’s 528 searches and 849 screenshots over three months (August to October 2026), all collected by hand and all downloadable.

How it’s collected · Findings · Limitations · How to cite it

Since I started in August 2026, a point buys 7.6% less travel on average. The pattern on this note is drawn from the data: one petal per program, longer when its points gained value.

The latest month of the index, step by step

The index has three months of prices so far, from August to October 2026, and each new month adds one step. Scroll down to walk through the latest: each dot is a trip I priced in September and again in October. Watch what happened to the price in points, the price in cash, and what a point was worth.

≤ −75%−50%No change+100%≥ +300%Point worth lessPoint worth moreAirline seats · 106Hotel nights · 45AirlinesHotels−12.8%−5.5%Value of a point+0.0%
151 trips

Each dot is one trip I priced twice: the same flight or hotel night, booked the same number of days ahead, in September and again in October.

Blue dots are flights. Green dots are hotel nights.

+20.3%

Each dot moves left if the trip cost fewer points in October, right if it cost more. The white line is the overall average.

Overall, trips cost 20.3% more points.

+7.9%

The same trips, priced in cash on the same search, converted to US dollars on the day.

Overall, cash prices rose 7.9%.

−10.7%

Divide the cash price by the points price and you get what one point is worth. Red: a point bought less. Blue: it bought more.

Overall a point bought 10.7% less. That one number, tracked month after month, is the index.

Chained onto the months before, a point now buys 7.6% less than in August, when the index began.

−12.8% / −5.5%

Airline points lost 12.8%. Hotel points lost 5.5%.

One average can hide two markets moving in opposite directions.
Why this data is worth using

Loyalty points work like a private currency, issued by companies that can change what it buys without notice. Governments publish their currency’s inflation rate every month; nobody publishes this one’s.

TPG and NerdWallet build their monthly value for each program partly from real prices, but that data isn’t public, and they don’t report how value changes over time. This index publishes every search: the same trips, priced the same way every month, each with its screenshot. That makes every number checkable, and it measures the change over time, not just this month’s level. How the two compare.

Because points behave like money, the questions economists ask about a currency apply directly: its inflation rate, its exchange rates (the card transfer ratios), whether a published price list holds like a currency peg, and how much warning the issuer gives. Points as a private currency.

Two prices from one searchPoints and cash, side by sideSo the value of a point is measured on each trip, not assumed.
The same trips every month88 trips × 2 booking distances176 searches a month across 27 programs, so each month compares like with like.
Evidence for every row849 screenshotsOne for each search, linked from its row, with personal details blacked out.
Failures kept, with reasons54 of 528 searches unpricedSold-out dates, missing award seats and broken sites stay in the data. Award availability is itself a result.
Program announcements10 changes loggedEach with its announcement date, effective date and days of warning, so announced and unannounced changes can be told apart.
IndependentNo sponsors, no affiliate linksNothing on the site earns money from a card sign-up or a click.

Questions the data can answer

Most are questions economists already ask about national currencies, asked here of one that companies issue. Each has a first analysis on the site and a spreadsheet you can download to run your own. With 3 months collected these are early results, and each one gets stronger as months are added.

If you’re studying something else this data could help with, I’d like to hear about it: chhajed.vidit@gmail.com.

What the index has found so far

All findings, with charts

How to cite it

Cite the monthly release you used. Releases are dated and never edited silently; any correction is listed with its date. The data is free to reuse under CC BY 4.0, with credit.

Chhajed, Vidit (2026). Loyalty Program Devaluation Index, Release R3, October 2026 [Data set]. Zenodo. https://doi.org/10.5281/zenodo.23546014

BibTeX
@misc{chhajed2026lpdi,
  author = {Chhajed, Vidit},
  title  = {Loyalty Program Devaluation Index},
  note   = {Release R3, October 2026. Hand-collected monthly data set},
  year   = {2026},
  publisher = {Zenodo},
  doi    = {10.5281/zenodo.23546014},
  url    = {https://loyalty-index.vercel.app/releases/2026-10/},
  urldate = {2026-10-21}
}
Download the data

Tools built on the index

Two tools put this month’s numbers to work: what a balance is worth, and whether a redemption beats the usual value, and what card points bought at each transfer partner. Every result can be linked and cited. Personal features, like saving your balances and getting an alert when a program devalues, are coming in Lieflat, my phone app, which runs on the numbers published here. Join the waitlist · @lieflatapp on Instagram.

Built by a high school sophomore

I’m Vidit Chhajed, a sophomore at Olentangy Orange High School in Ohio, and behavioral economics is what I spend my time on. I study points because they’re a currency companies issue for themselves, and almost nobody measures what it buys. I designed this index’s method, I collect every price myself each month, and I built this site to publish it. It has no sponsors and no affiliate links. If you study loyalty programs, pricing or consumer finance, I’d welcome questions about the method, or a conversation about using the data.

My other work, including my own experiments, is on my personal website.